Learning objectives
- Relate the area of a full circle to the area of the square that contains it.
- Estimate π using four times the fraction of uniformly sampled square points falling inside the circle.
Mathematics · Interactive learning companion
Use the area ratio of a full circle inscribed in its surrounding square and random sampling to estimate π.
Landscape activity · use fullscreen on a phone for larger controls
Learning focus: Use the area ratio of a full circle inscribed in its surrounding square and random sampling to estimate π.
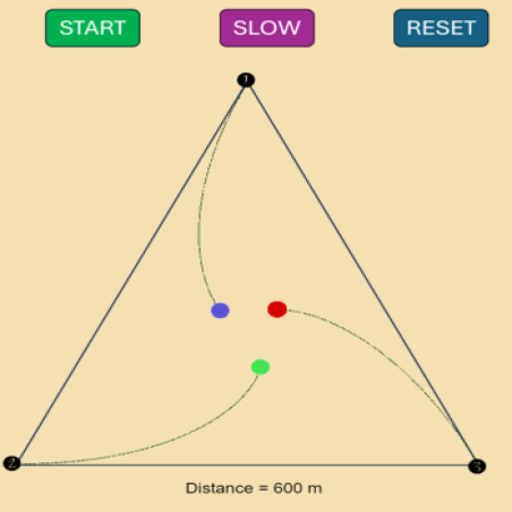 Convergence Chase Simulation
 explores a classic pursuit problem where moving points continuously chase one another. Stu…
View Details
Play
Free Activity
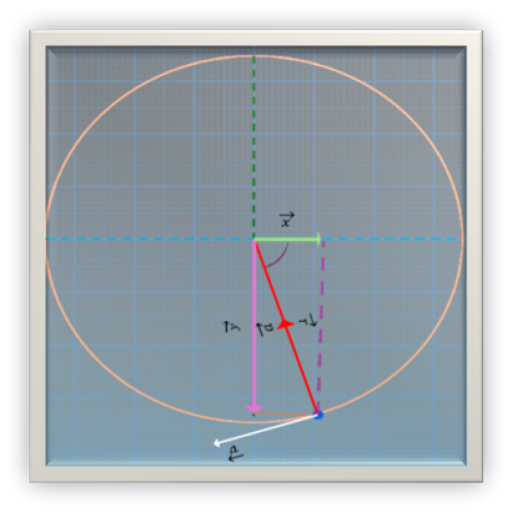 Uniform Circular Motion Simulation
 helps students visualize motion in a circle at constant speed. Learners observe radi…
View Details
Play
Free Activity
 Physics Balancer 1: Mass Balance Simulation
Physics Balancer 1 is a visual mass-balance simulation that helps students understand equality of mass and basic balanc…
View Details
Play
Free Activity
 Spring Lab 1: Real-Time Physics Simulation
Spring Lab 1 is a real-time physics simulation for exploring springs, load, extension, and elastic behavior. Students c…
View Details
Play
Free Activity
 Pendulum Lab 1: Real-Time Physics Simulation
Pendulum Lab 1 is a real-time simulation for studying pendulum motion. Students can observe oscillation, change variabl…
View Details
Play
Free Activity
 Monkey and Hunter Physics Simulation
Monkey and Hunter is a classic physics simulation for understanding projectile motion and gravity. Students observe how…
View Details
Play









💭 Comments