Learning objectives
- Compute the arithmetic mean from all observations.
- Find the middle ordered value(s) and most frequent value.
Mathematics · Interactive learning companion
Calculate mean, median and mode and explain why they can describe the same data set differently.
Landscape activity · use fullscreen on a phone for larger controls
Learning focus: Calculate mean, median and mode and explain why they can describe the same data set differently.
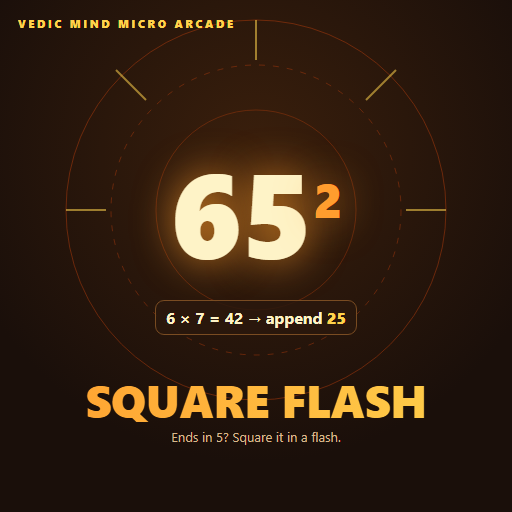 Vedic Mind Micro Arcade
 groups two short playable teaser games into one package. Learners can choose Near-Base Sprint f…
View Details
Play
Free Activity
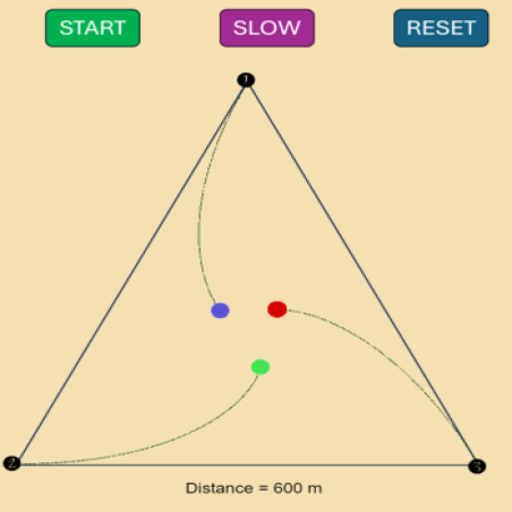 Convergence Chase Simulation
 explores a classic pursuit problem where moving points continuously chase one another. Stu…
View Details
Play
Free Activity
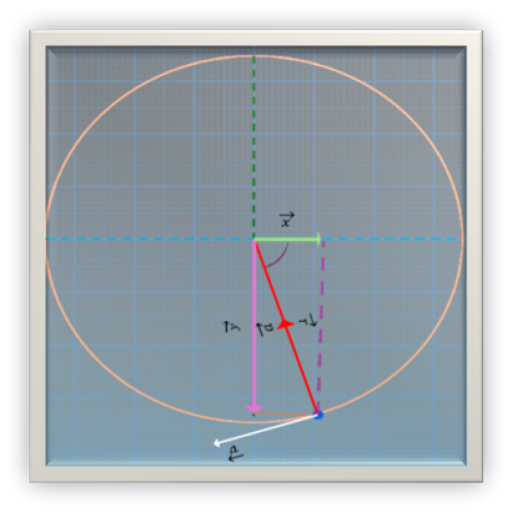 Uniform Circular Motion Simulation
 helps students visualize motion in a circle at constant speed. Learners observe radi…
View Details
Play
Free Activity
 Visual Vector Resolution in 2D
 is an interactive simulation for resolving a vector into rectangular components. Student…
View Details
Play
Free Activity
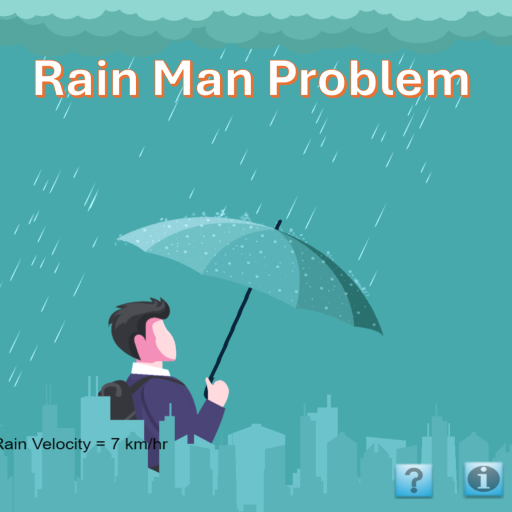 Rain Man Problem: Relative Velocity Simulation
Rain Man Problem is a relative velocity simulation that helps students visualize apparent rain direction and motion bet…
View Details
Play
Free Activity
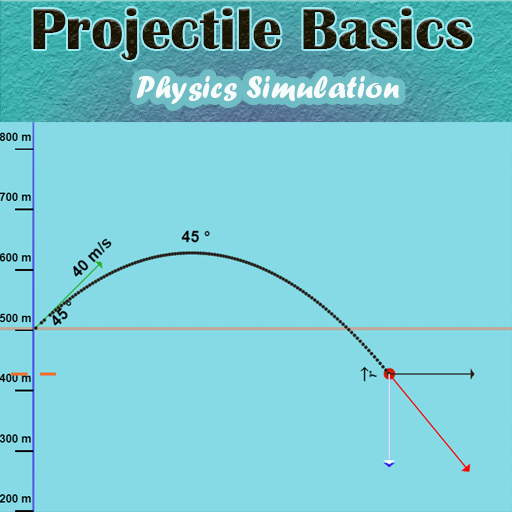 Visual Projectile Motion Simulation
 helps students explore the path of a projectile under gravity. Learners change laun…
View Details
Play












💭 Comments